New Relic spoils us with its beautiful charts and intuitive user-interface but behind the scene is a complicated concept of data model that allows these awesome feature to be even possible.

For example, looking at the chart above taken from a PHP+MySQL Web application, one could easily infer that spikes in the graph signify something is "wrong" and it also tells us that a huge percentage of the application's response time is being spend in pulling some data from MySQL.
But go on deeper and you'll be encountering a lot of keywords that you don't know what is the meaning in NewRelic's context.
- What is a Transaction?
- What are Transaction Traces?
- Events Database? what the hell is that, and how it is related to this thing called metrics?
- CPM, RPM, Apdex... what the hell any of this has to do with my web application?
Events vs Metrics Timeslice
Every data you'll see in New Relic in general, can be either an "Event" or a "Metric Timeslice". To oversimplify it, we can roughly describe the two as:
- Event- a record of "something" that had happened. For example when a web page is viewed or a backend script is executed, or a PHP script is executed. Along with these event are Attributes that further describe the event itself, for example the browser that was used when the web page is viewed, the country where it is viewed, and what particular date and time the event it had happened. You can then slice and dice the events further based on these Attributes. You can easily think of Attributes as Fields in the tables present in the Events database. The tables themselves can be of wide variety and is commonly called as Event Type, for example Transaction and PageView are the most common event you'll be dealing with.
- Metric Timeslice- is like a "snapshot" of certain value of interest during the particular period of time. For example, it is like asking "how much we had earned now" (metric timeslice) vs asking "give me a list of sales we have right now" (events). In this example, you are not really interested in all the details, but only asks for a simple value, a number associated with time (the time when you asked the question) vs actually asking the entire list of sales that was made including all the details.
Each New Relic product records its own Events and Metrics Timeslice
The word "New Relic" itself is just a brand, under it are their products which in turn records different kind of Events and Metrics Timeslice
- Application Performance Monitoring(APM)- Transaction and TransactionError events
- Browser- PageView and PageAction event types
- Infrastructure- processes, events, storage, and network etc
- Mobile- Mobile event types
- Synthetics- SyntheticCheck, SyntheticRequest, and SyntheticPrivateMinion event types
Your Account > New Relic Product > Event or Metric Data
Picture it like this in your mind: My Company is using New Relic products, which in turn collects data from my web servers, those data can be either an Event or a Metrics Timeslice.
Let's zoom into PageView
PageView is the first data that is easiest to comprehend, as the name itself describes what its about: when a surfer visited a page, they had "viewed" the page. So, an event happened, in this case the web page is viewed. As we know from earlier section, the New Relic Product that is responsible for recording this is the NewRelic Browser
Here is a list of commonly used Attributes(fields) in the PageView Event Type:
- timestamp - UNIX timestamp when the event had happened
- domain - the domain visited
- pageUrl- the url of the page viewed
- session - a unique identifier of that visit
- userAgentName - name of the browser used (Chrome, Firefox etc)
- duration - how long the page loaded
That being said, now we have this hierarchy:
Account > NR Browser (New Relic Product) > PageView(Events Database)
Querying the raw data using NRQL
Now that you understand that there is such a PageView event type, and a few of its attributes. Let us see how you can perform some basic queries to that table directly. Go to the NewRelic Dashboard and head into the section called Insights (not all subscription might have this)
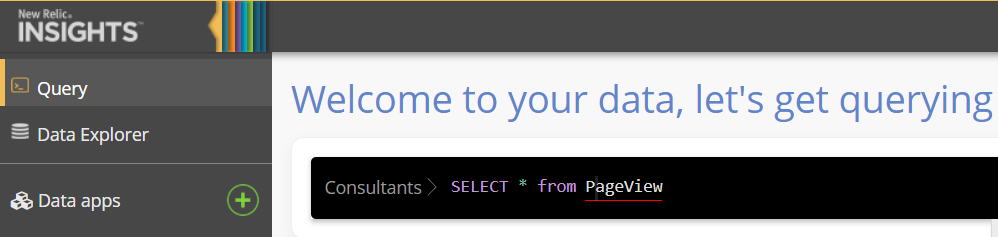
The above basically allows you to select all fields from the PageView table - sounds familiar right?
It is like an old-school SQL-syntax you already know, except for the fact that all the data collecting parts (INSERT/UPDATE is already being automatically inserted for you) and the only thing you need to worry about is querying and analysing the collected data itself.
Here is a few tricks you can do with NRQL
filter by country code
SELECT * from PageView where countryCode='US'show all page views from 1 day ago until 30 minutes ago
SELECT * from PageView SINCE 1 day ago UNTIL 30 minutes agowhereas SINCE specifies the start and UNTIL specifies the end range of the time filter.
count pageviews for each domain
SELECT count(*) from PageView FACET domain
Things to keep in mind
- The timezone being used by Insight query is whatever the timezone of the computer you are working on. If you are working with a buddy who is in a different timezone, if might be a good idea to specify the timezone via WITH TIMEZONE parameter
- If you did specify UNTIL, it defaults to the value of NOW
- If you want to explore other fields available, click the Data Explorer link in the sidebar, and browse all kinds of events/attributes available
Transactions
While NewRelic Browser deals with Front-end events, such as PageView, there is a lot out there happening aside from what is being displayed in the browser. For example
- PHP code connecting to MySQL db server and executing query
- posting/receiving data to a 3rd party service/api
- a background script running, processing long running tasks, such as resizing media files or sending emails
That is what New Relic's APM (short for Application Performance Monitoring) is for.
Just like how you can query NR Browser's events by querying the PageView event, APM stores its data in Transaction
You can inspect the fields related to this event in Data Explorer, execute a few queries to see what is there. And more often than not, you'll be able to get the hang of it like how you did in PageView event.
At New Relic, a transaction is defined as one logical unit of work in a software application. Specifically, it refers to the function calls and method calls that make up that unit of work. For New Relic APM, it will often refer to a web transaction, which represents activity in an application between the application receiving a web request and a response being sent
Within each Transaction, are Segments which are the actual calls to the database etc. Note that the Transaction.Name values might confuse you, as the values can be taken based on "backend" script that is executing that. For example, if your app is using as Laravel Framework, the transaction name might end up as WebTransaction/Action/Home/index whereas the Home is the Controller and the Index is the method of that controller.
Traces
Everytime some "anomaly" are found, such as very slow transactions, New Relic records all the available function calls, database calls, and external calls that was made via that transaction. This is so you can troubleshoot them and inspect why it is behaving that way. For example:
![]()
More often, that is the ONLY thing you are interested into, as it signify some unexpected issue happening within your infrastructure. Unfortunately, this can be only inspected via the APM UI (at the time of writing, Feb 2017) and one can not query this via NRQL.
You can view such, by going to New Relic APM, on the side bar, click the Transactions. There would be a Transaction traces section in the footer (if there is none, great. means your app is working fine!)
Custom Attributes
Some of you might say, all these data collected by NewRelic is great, but what if I want to associate some custom data?. That is where the Custom attributes is for, since we know that attributes is just a fancy name for field in those events database, one can easily infer that adding additional field to a Transaction of PageView is simply adding custom attributes during the application execution. This can be done via frontend or backend code. See the official documentation to know how to do this.
Once you had collected a custom attribute, you can easily query those via NRQL, you can use it as WHERE clause in Insight, which allows you to easily filter the data related to a field specific to your application's use-case (username, invoice id etc)
All in all, that is all the information you need to get started in doing some more serious stuff with your NewRelic account. The more you poke with it, the more you gonna have a full understanding of your NewRelic data
Where to go from here?
Visit Glossary to have a better understanding of terms being used in New Relic. Once you have done that, explore the documentation about Transaction and NRQL
Did you find this useful?
I'm always happy to help! You can show your support and appreciation by Buying me a coffee (I love coffee!).